


Society
29.12.22
Society
Climate TRACE – Tracking Greenhouse Gas Emissions
The non-profit coalition Climate TRACE independently tracks greenhouse gas emissions, offering unprecedented detail and speed. This serves to make climate action easier, faster, and more meaningful. Read more about the greenhouse gas emissions tracker here.
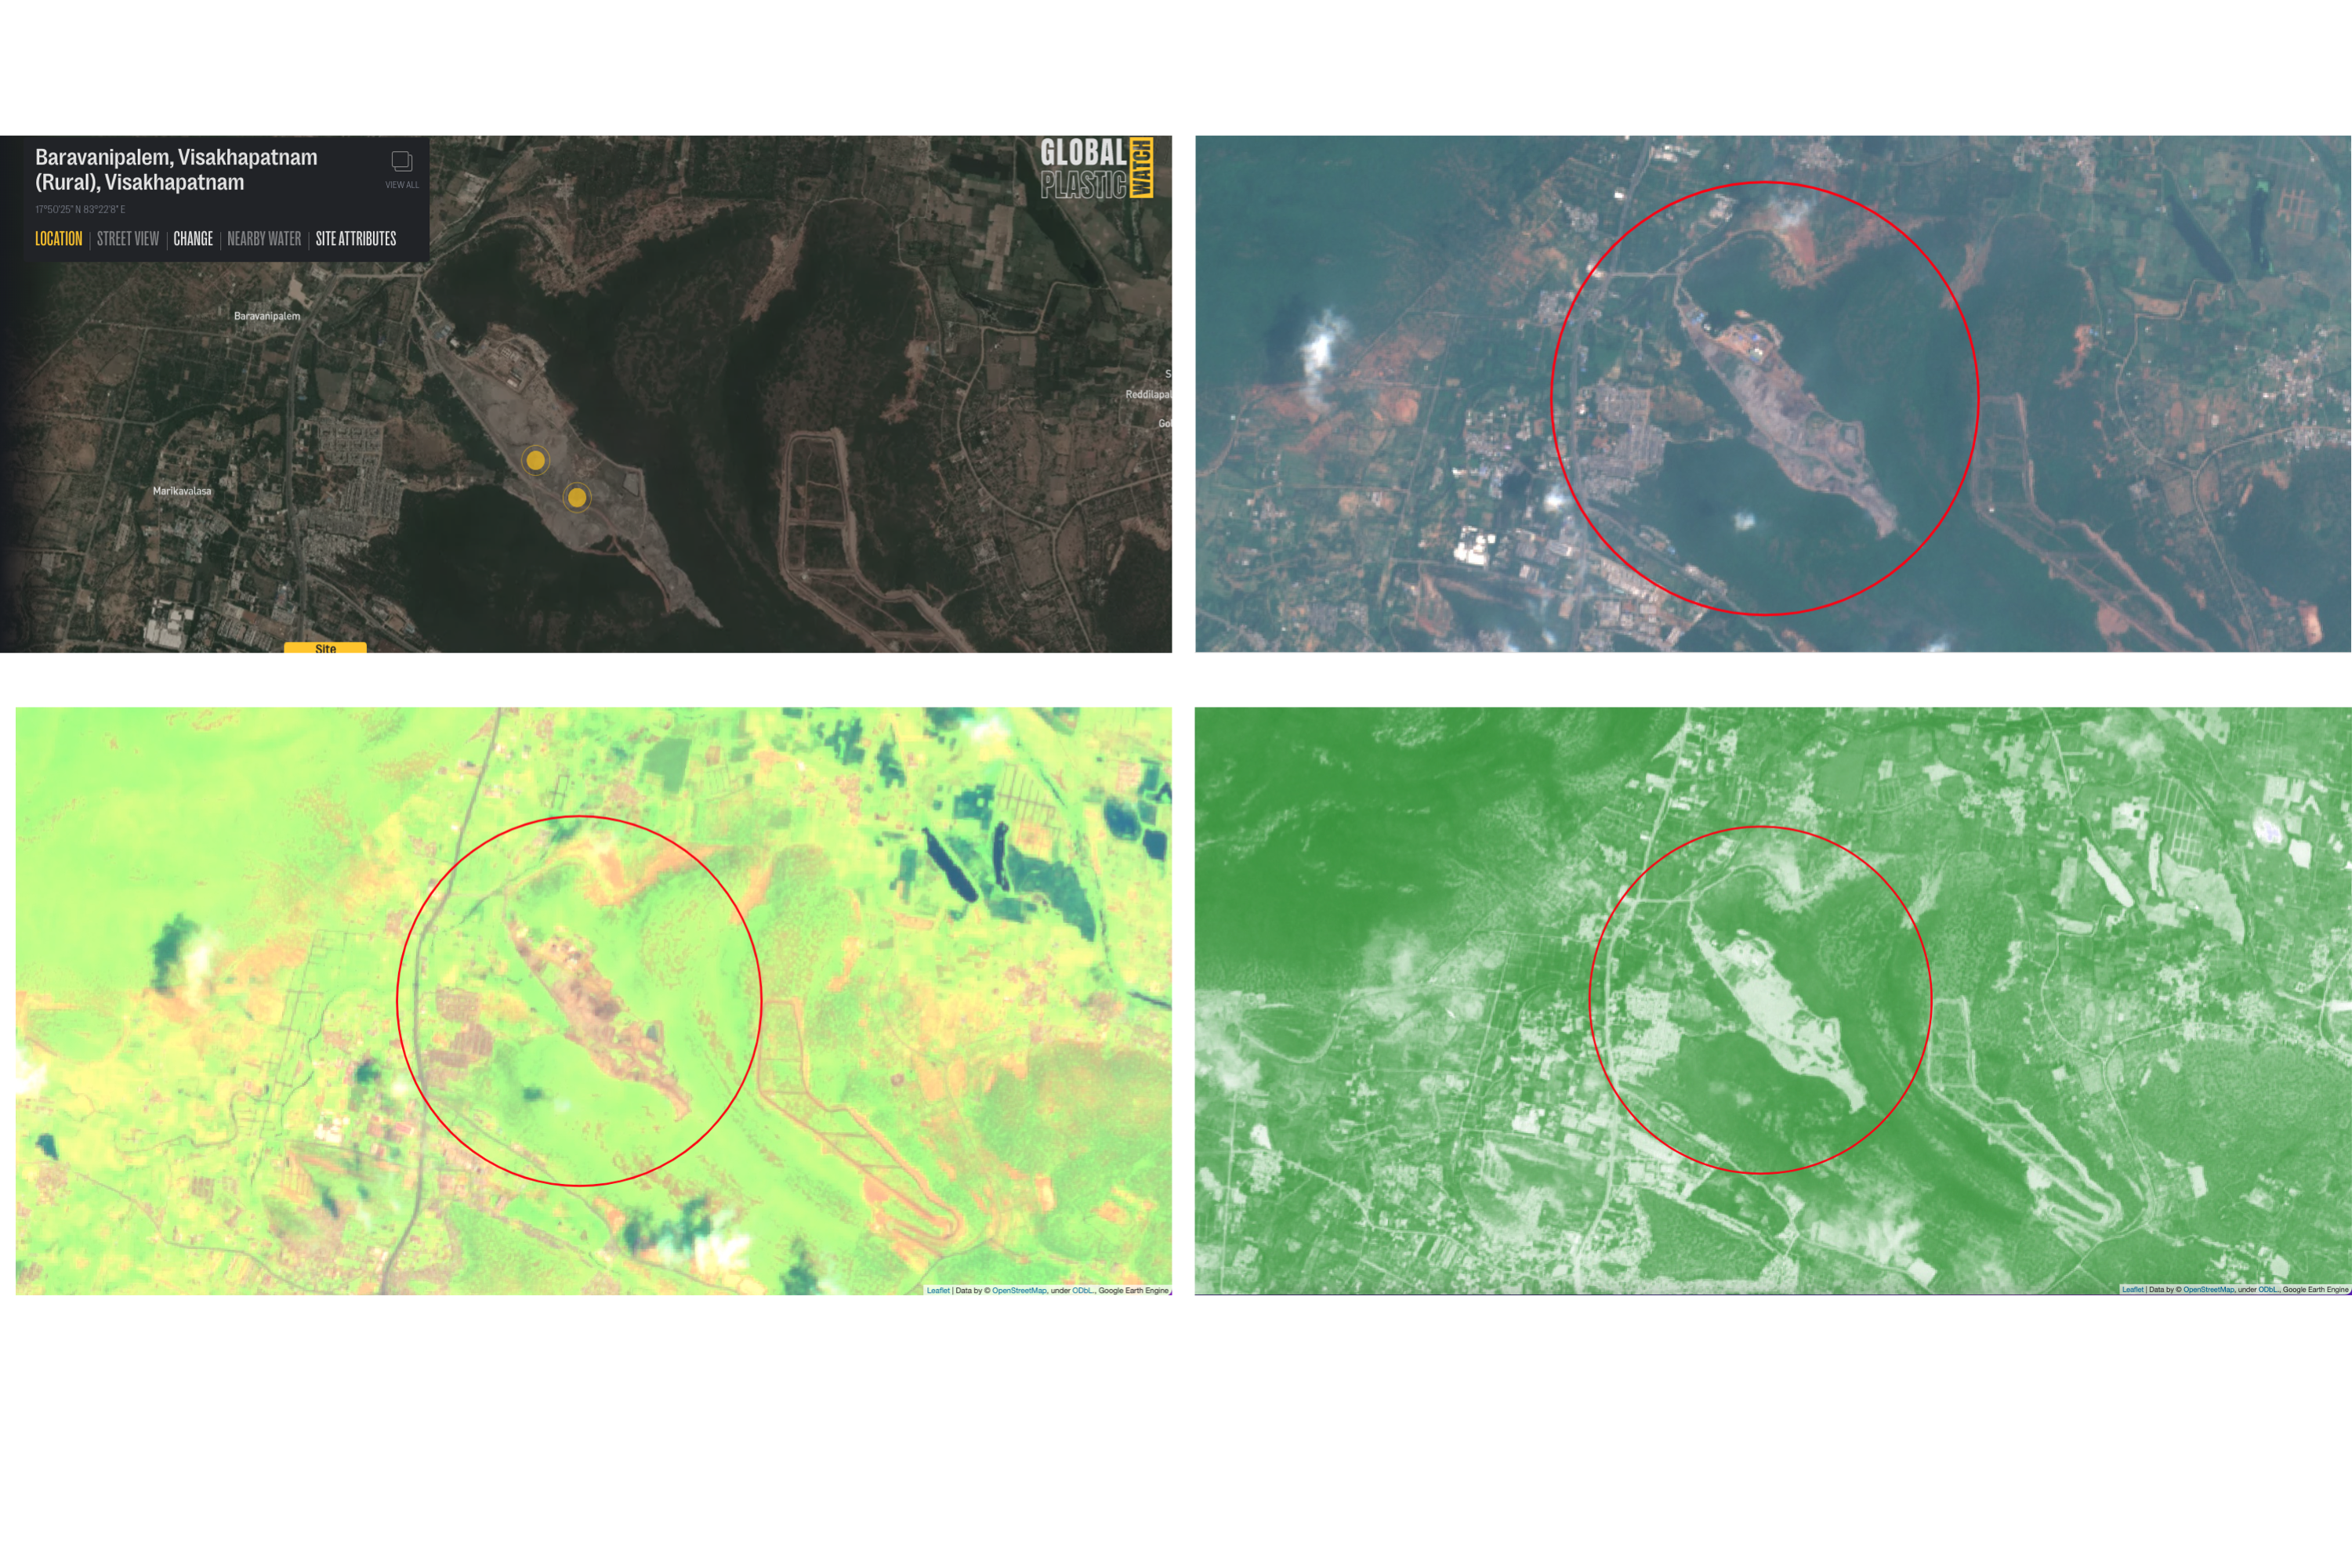
The Sentinel-2 satellite is able to measure the land surface at different wavelengths. Using these wavelengths and combining them together allows one to separate out the landfill (in the red circle) from the rest of the land area. With this approach, Climate TRACE can identify unknown landfills to estimate methane emissions. Source: Sentinel-2 imagery from the European Space Agency (ESA)
Billboard
Skyscrapper
Halfpage
How Climate TRACE works
Climate TRACE is on a mission to identify the highest emitting greenhouse gases and their sources. It provides the largest available global emission inventory, listing more than 70,000 sources of emissions. According to the organisation’s research, half of the 50 largest sources are oil and gas production fields and their associated fields. The top 500 sources, representing less than 1% of the total Climate TRACE inventory, account for about 14% of global emissions for 2021. This is more than the annual emissions of the US.
The work of Climate TRACE is based on the underreporting of oil and gas production globally. The company wants to show that countries required to report regularly to the UNFCCC have emissions up to three times as those countries not required to report. The comprehensive country-by-country data of the database includes 2021 annual information and therefore provides an emissions inventory for every party to the Paris Agreement. This was particularly important for COP27 in Sharm El-Sheikh in November 2022.
The database provides a full view of annual greenhouse gas emissions of countries since 2015, the year of the Paris Agreement. Information has been sourced independently, according to Climate TRACE. It is primarily based on direct observations of activity rather than on self-reported data.
Members of the non-profit coalition are AI specialists, data scientists, researchers, and NGOs. 10 coalition members including Blue Sky Analytics, Carbon Yield, the Johns Hopkins University Applied Physics Lab, and over 90 other contributors jointly created Carbon TRACE.
Informing decarbonisation decisions
The goal of Climate TRACE is to inform and accelerate decarbonisation decisions and efforts worldwide. The detailed, timely data is available for free. It helps stakeholders such as world leaders, CEOs, investors, journalists, and activists to track progress toward net-zero goals, prioritising actions to achieve the greatest impact.
“The climate crisis can, at times, feel like an intractable challenge – in large part because we’ve had a limited understanding of precisely where emissions are coming from,” said former U.S. Vice President and Climate TRACE founding member Al Gore. “This level of granularity means that we finally have emissions data that enable us to act decisively. It also means we can prioritise efforts to achieve the deep cuts in greenhouse gas pollution we need to prevent the most catastrophic impacts of the climate crisis.”
Climate TRACE is also the first global inventory of its kind that identifies and tracks the largest individual sources of emissions. The data shows emissions across twenty major sectors of the economy. It illuminates the role of a handful of individual sources on global emissions. For example, power plants alone represent more than half of the emissions and assets in the top 500 list.
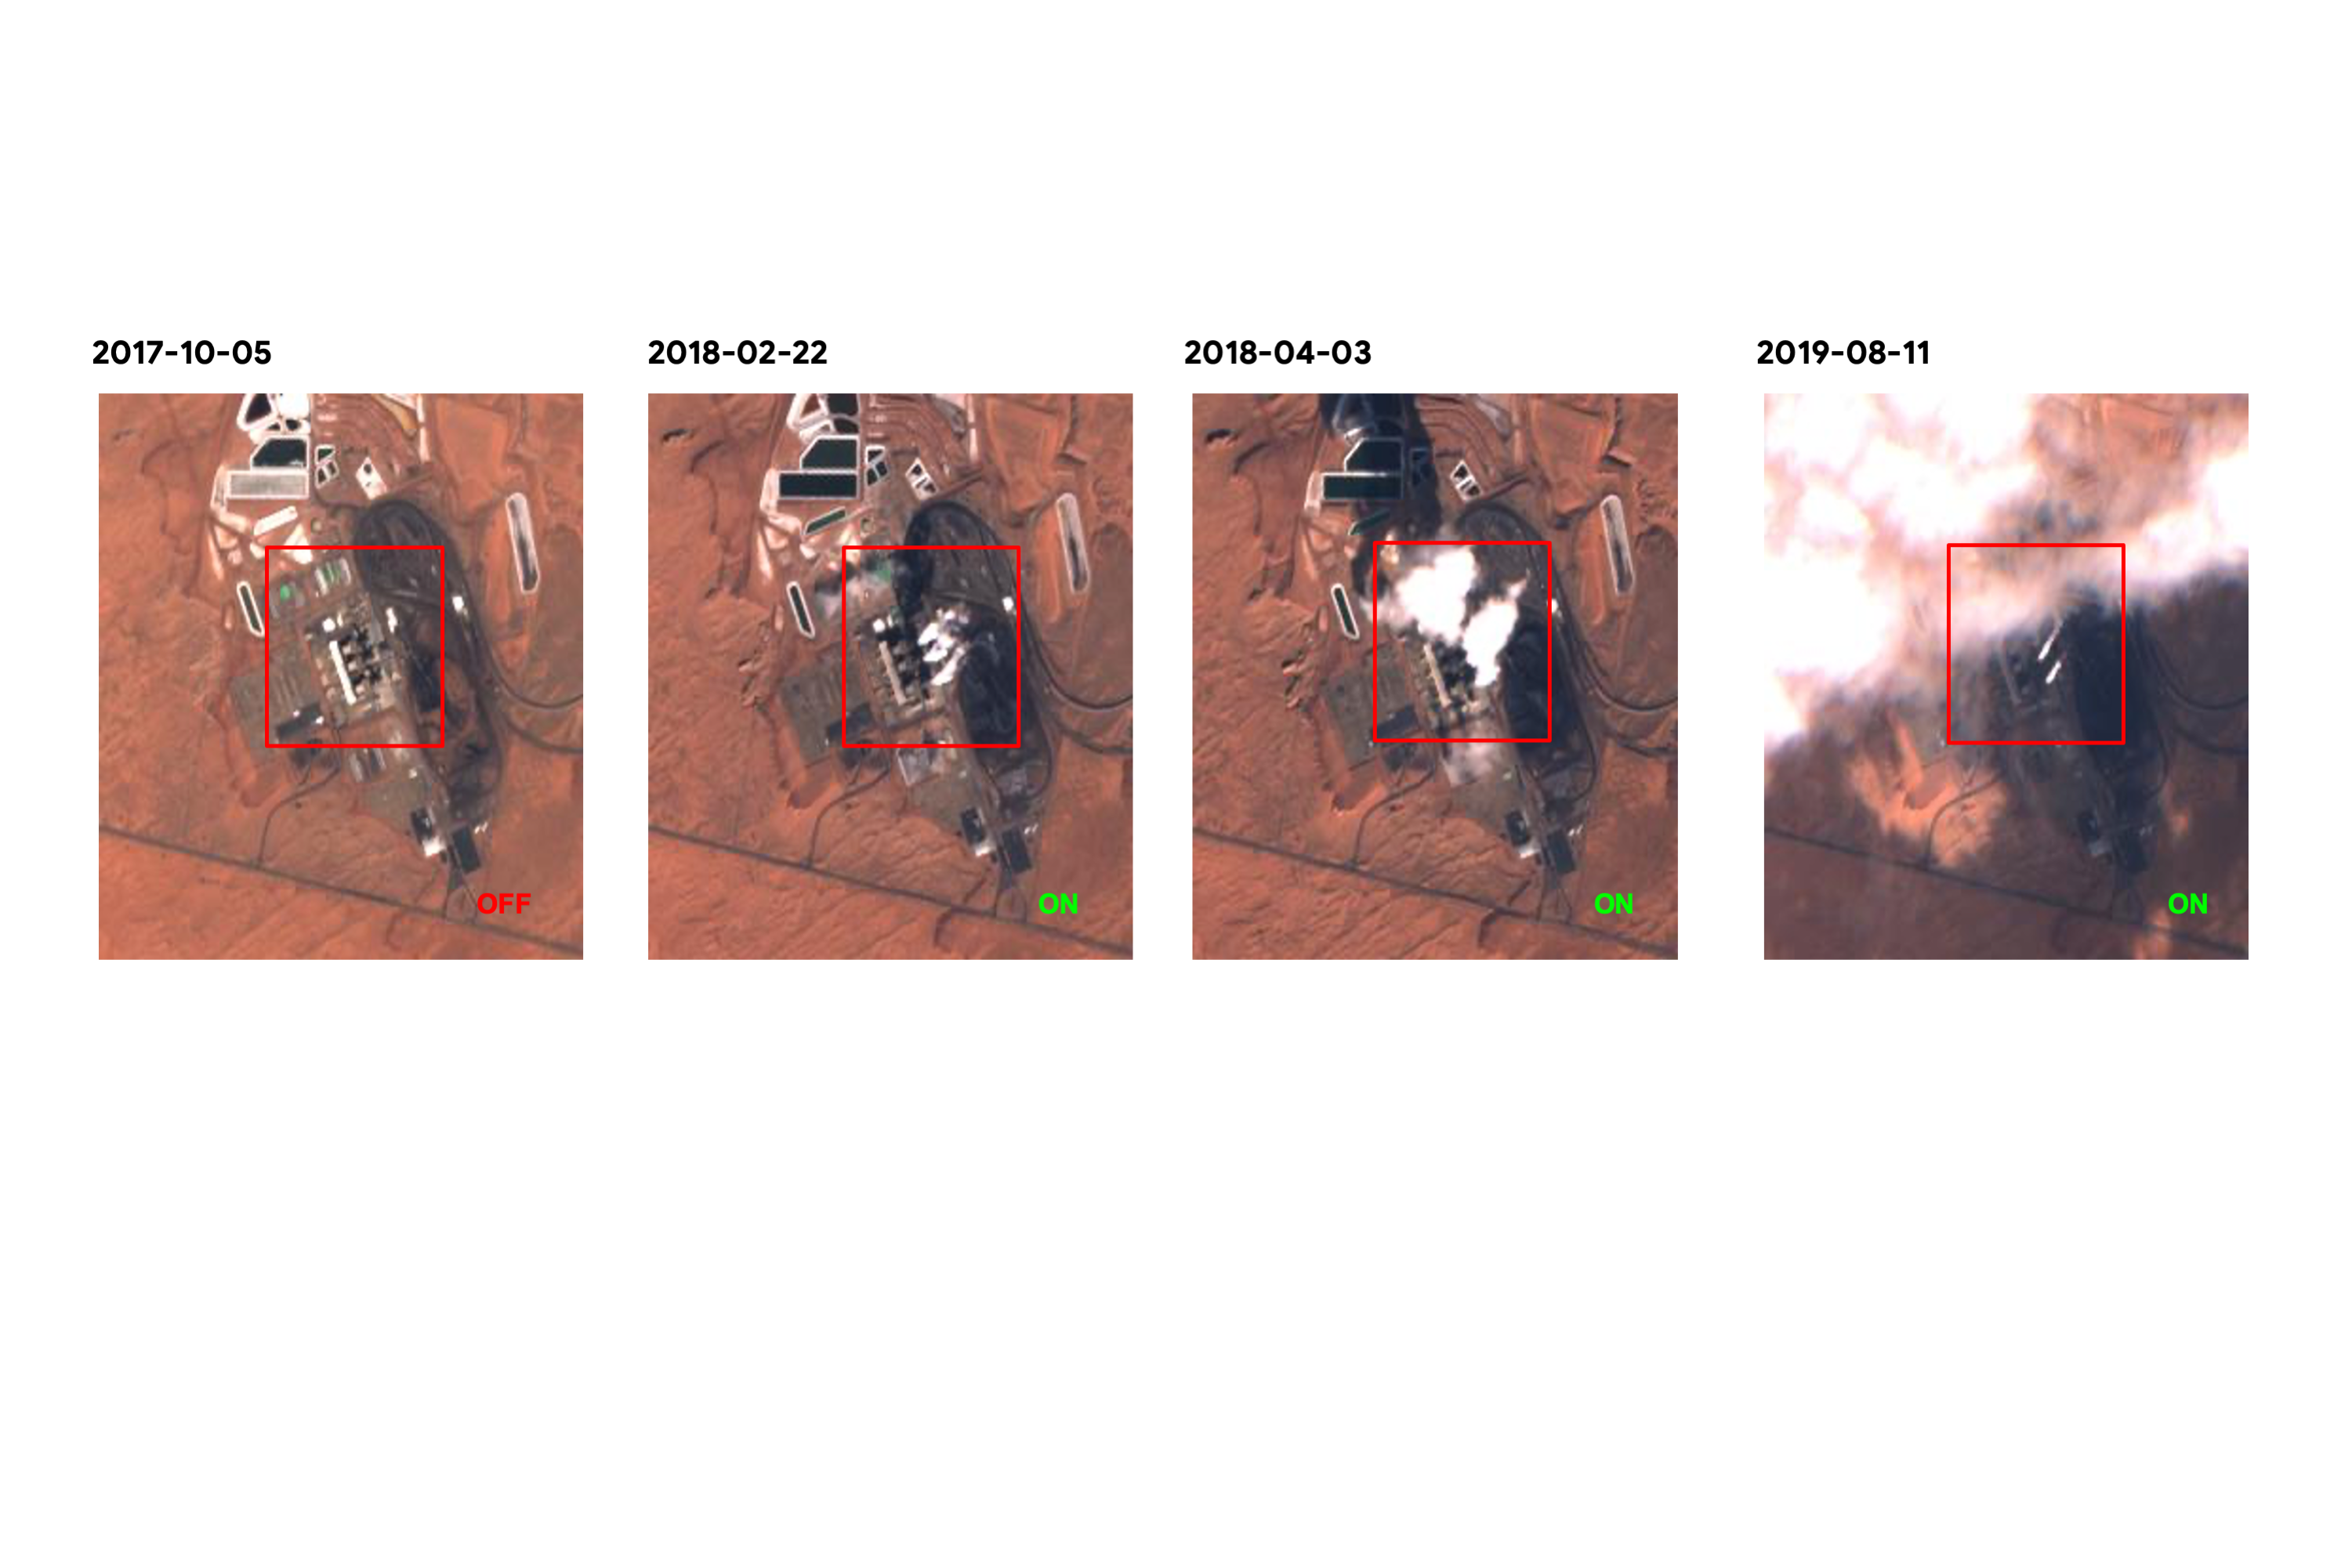
Estimating power plant emissions from space indirectly: Visible plumes from Sentinel-2 optical imagery indicate whether a plant is generating at a given time. This information can be used in a machine learning model to estimate power plant activity. Source: Sentinel-2 imagery from the European Space Agency (ESA).
Worldwide contributors
“The release of this massive dataset represents the combined efforts of more than 100 contributing organizations worldwide,” said Gavin McCormick, founder and executive director of Climate TRACE convening member WattTime. “Between us all, we’ve been able to estimate the emissions of nearly all the largest emitting facilities on the planet. Our work is far from done, but I’ve been thrilled to hear from climate negotiators, corporate sustainability teams, investors looking to decarbonise, climate scientists, and even activists that this information is already a game changer that can help them make better decisions and decarbonise faster.”
The impact of Climate TRACE’s emissions monitoring is most apparent in the oil and gas sector: The inventory found that emissions from oil and gas production, transport, and refining had been significantly underestimated before 2021. This is partly due to limited reporting requirements and underestimates of methane emissions from intentional flaring and leaks.
Evidence from satellite-detected emissions in places like Russia, Turkmenistan, the US, and the Middle East, shows emissions from harmful practices. The organisation’s satellite coverage, but also its remote sensing and technologies like artificial intelligence and machine learning, enable the direct spotting of sources of greenhouse gas emissions. In addition, Climate TRACE can detect and analyse activities that are otherwise invisible or impossible to detect.
Creating accountability
As per the end of October 2022, no country in the world has submitted a complete account of its 2021 emissions to the UNFCCC. 52 countries have not submitted any emissions inventories at all for the past ten years. With Climate TRACE’s database, it is possible to find emission information for the years 2015-2021 for every party to the Paris Agreement, and many other territories.
The 2021 updates to the inventories add emissions data for 2021 and provide sub-sector specificity to national inventories. With more than 300 satellites, over 11,000 air-, land-, and sea-based sensors, and additional public and commercial information, the inventory will become more and more comprehensive and timely. The goal is to develop the first global independent emissions inventory based on direct observation.
Technological advances and the latest research on emissions will allow Climate TRACE to bring increased understanding and precision to emissions tracking. Detailed methodology documents are available. They show the different approach for each sector, data inputs, modelling, and relevant peer-reviewed research.
In 2023, Climate TRACE will further expand and refine the inventory from at least the top 500 sources of emissions per sector, covering every major industrial-scale source of emissions in the world. Cities will also benefit from this data the more specific it becomes.
Medium Rectangle
Halfpage


Billboard
Other Articles you may like


